
How to Look Up Prince William County Jail Population Data
Population data for the local jail comes from official reports, not a live roster. The Prince William-Manassas Regional Adult Detention Center publishes annual reports each year. Those reports hold the counts that matter. Start there. The reports are posted as PDF files and span many years, so you can read both the latest year and older ones for trends.
The county keeps an archive of these reports online. It covers reports from 2009 through 2024. Each one is a download. To find a number like average daily population, open the most recent report and look for the statistics section. The figures live inside the PDF tables, so you may need to scroll or use the search box in your PDF reader.
The annual report archive is the main source for these numbers.
You can open the ADC annual reports archive to download any year from 2009 forward.
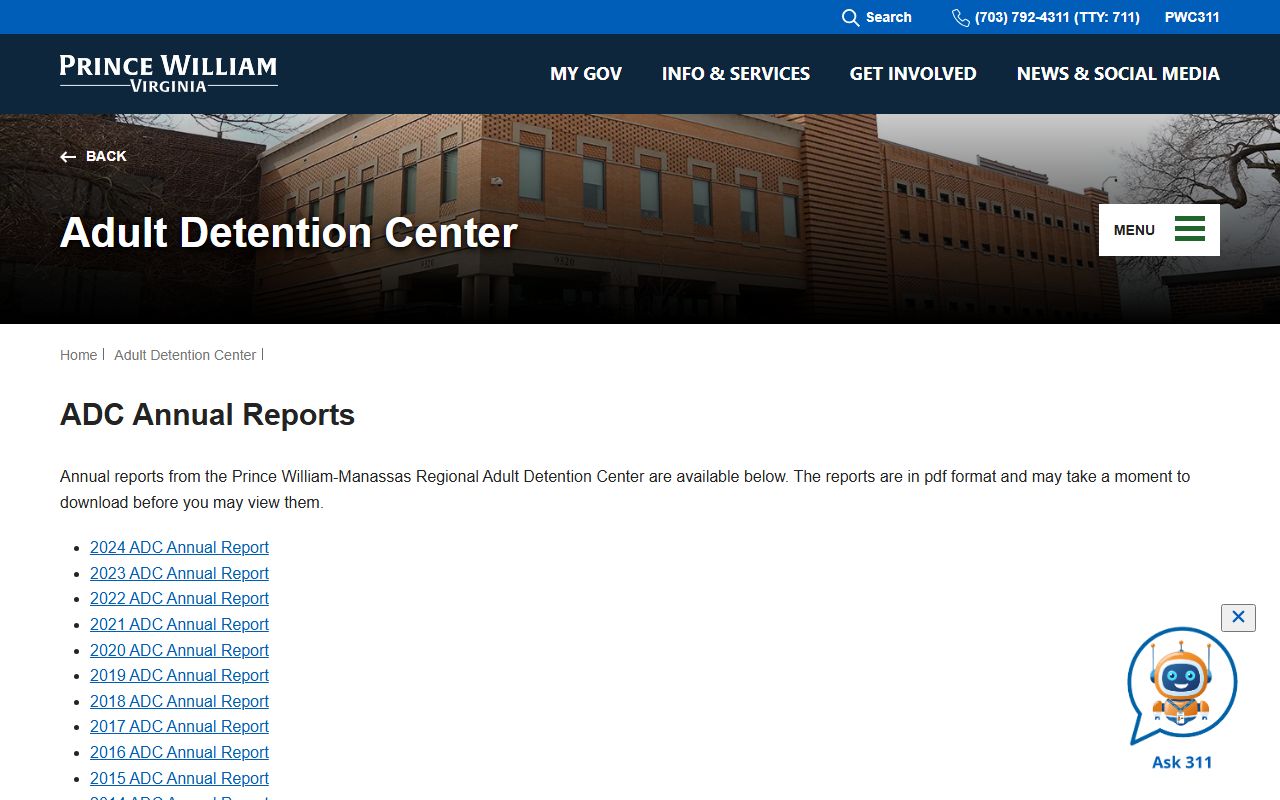
Each report bundles population, program, and budget data for the year, so it is the best single stop for local figures.
If you need a number that is not in the report, call the ADC. The main line is (703) 792-6420. Staff can speak to current custody questions that the public reports do not answer.
Note: The annual reports are static yearly snapshots, so the live jail count on any given day may differ from the figures published for the prior year.
Prince William County Jail Capacity Overview
The local jail is a regional facility. It serves Prince William County, the towns of Occoquan, Quantico, Triangle, Dumfries, and Haymarket, plus the Cities of Manassas and Manassas Park. The FY2023 annual report indicates the ADC managed five facilities totaling over 270,000 square feet of space. That gives a sense of physical scale even where a single rated bed count is not published in plain text.
The exact rated capacity is best read from the annual reports themselves. The table below lists the main facility and where to confirm capacity figures.
| Facility | Address | Rated Capacity | Where to Confirm |
|---|---|---|---|
| Prince William-Manassas Regional Adult Detention Center | 9320 Lee Avenue, Manassas, VA 20110 | See annual reports | Rated capacity and average daily population are published in the ADC annual reports, not on this page. |
Capacity is more than a single number. A jail can hold many classes of inmates, and bed counts shift with renovations or unit changes. The five-facility figure from FY2023 shows the ADC runs more than one building. For the current rated capacity, the annual report for the year you want is the right source.
Average Daily Population in Prince William County
Average daily population, often shortened to ADP, is a core jail metric. It is the mean number of inmates held per day across a reporting period, usually a fiscal year. ADP smooths out the daily swings. One day a jail may be busy, the next day quieter, and ADP gives a steady figure to compare year to year.
For the local jail, the ADP figure is published in the ADC annual reports. It is not posted as a live number on the county site. To read it, open the report for the year you want and find the population or statistics section.
ADP differs from a snapshot count. A snapshot is the head count at one moment. ADP is the average over many days. Both matter, but for trend study the ADP is the cleaner number. The reports also tend to list bookings and releases, which feed into how the average forms.
Note: The specific average daily population for Prince William County is not restated here because it must be read from the official annual report PDF for the year in question.
Demographic Breakdown of the Prince William County Jail Population
A demographic breakdown sorts the jail count by traits like sex, age, and race. These splits help show who is held and in what share. The local ADC annual reports are the source for any county-level demographic figures. The county does not publish a live demographic dashboard for the jail.
Because exact county percentages are not published outside the reports, the safest path is to open the latest annual report and read its tables. The categories below are not Prince William County numbers. They show the kinds of groups a demographic table usually covers, so you know what to look for.
- Sex - the split between male and female inmates.
- Age range - groups such as young adults through older adults.
- Race and ethnicity - the share of each group held.
- Custody class - how inmates are sorted by security level.
State data can fill the gap for context. The Virginia Department of Corrections posts population reports that break down state custody by several traits. Those are statewide figures, not local jail figures, but they show how a demographic table reads.
State population reports add labeled context to a local search.
You can review the VADOC population reports for statewide demographic context, kept clearly separate from county jail data.
The VADOC figures cover state prison custody, so treat them as Virginia statewide context and not as a Prince William County jail count.
Pretrial vs Sentenced Jail Population in Prince William County
Jail populations split into two broad groups. One group is held before trial. The other has been sentenced. The two groups can behave very differently in size and length of stay. A clear split helps explain why a jail count rises or falls.
Pretrial inmates are people awaiting a court date. They have not been convicted. Many are held because bail was set, or because no bond was granted. Sentenced inmates have been convicted and are serving a term, often a misdemeanor sentence served in the local jail. The table marks each group and where the county figures live.
| Group | Meaning | County Figure Source |
|---|---|---|
| Pretrial | Held while a case is open; not yet convicted. | ADC annual report; not published on this page. |
| Sentenced | Convicted and serving a jail term. | ADC annual report; not published on this page. |
For the local pretrial and sentenced counts, the annual report is the source. As a labeled national reference, the Bureau of Justice Statistics has long reported that a large share of the U.S. local jail population is held pretrial. That is a national pattern, not a Prince William County figure. Read the local report for the county split.
Misdemeanor vs Felony Jail Population in Prince William County
Charges sort into misdemeanors and felonies. A misdemeanor is a lesser offense. A felony is a more serious one. The split shapes who stays in the local jail and who moves to state prison. Many felony defendants pass through the jail before any prison transfer.
People serving short sentences for misdemeanors often stay in the local jail for the whole term. People convicted of felonies with longer terms usually transfer to Virginia Department of Corrections custody. So the jail count leans toward pretrial detainees and misdemeanor sentences, while long felony terms are served at the state level.
For the local count by charge class, read the ADC annual report. To track a person once they leave the jail for state prison, the VADOC locator and population reports are the right tools. Local jails hold pretrial defendants and short sentences, while long felony terms are served in state prison, so the jail count is not the full picture of county convictions.
Mental Health and Medical Population
Jails hold people with health and mental health needs. A portion of any jail population needs medical care, mental health support, or both. The ADC annual reports describe programs and services tied to these needs. The exact share of inmates in each program is read from the report, not posted live.
Medical and mental health services are a major part of jail operations. Intake screening, ongoing care, and program participation all show up in the annual report. Counts for these services live in the report tables. To find them, open the latest report and look for the program and services sections.
- Open the most recent ADC annual report from the archive.
- Find the programs and services section of the PDF.
- Read the figures for medical, mental health, and rehabilitative programs.
The ADC mission includes rehabilitative programs meant to cut repeat offenses after release. Program participation counts often appear alongside population data in the same report, so one download answers several questions at once.
National and State Context for Prince William County Jail Population
Local numbers read better next to state and national figures. A jail rate is often shown as inmates per 100,000 residents. That lets you compare places of different sizes. The Bureau of Justice Statistics tracks national jail rates, and VADOC reports cover Virginia state custody. Both serve as labeled context, not as Prince William County counts.
The comparison block below shows how a rate-per-100,000 view is built. The county row is marked as not published, since the county does not post a per-100,000 jail rate. The state and national rows are labeled context only.
| Level | Rate per 100,000 | Source |
|---|---|---|
| Prince William County | Not published | Read jail counts from the ADC annual reports; no per-100,000 rate is posted. |
| Virginia statewide | See VADOC reports | Virginia statewide context from VADOC population reports. |
| National | See BJS reports | National context from the Bureau of Justice Statistics. |
Use these levels as a frame, not as one number. The county jail count is a raw figure in the annual report. The state and national rates come from VADOC and BJS, and they describe far larger populations. Keep the labels straight so you do not read a national rate as a local one.
Federal cases are tracked apart from county jail counts.
For a federal frame, the U.S. Bankruptcy Court for the Eastern District of Virginia handles federal bankruptcy matters that are recorded in their own systems.
Federal case and bankruptcy data are tracked separately from county jail population, so a federal court site will not show local jail counts.
Prince William County Jail Population Trends Over Time
Trends tell you more than a single year. To see how the jail count has moved, line up several annual reports in a row. The archive holds reports from 2009 through 2024, so a long view is possible. Pull the same metric from each year and compare.
A clean trend study uses one figure across years. Average daily population is the usual choice. Read the ADP from each report and chart the years side by side. You can do the same with bookings, releases, or length of stay if the reports list them.
- Download the ADC annual reports for the years you want to compare.
- Find the same metric in each report, such as average daily population.
- List the figures by year to see the direction of the trend.
For a wider lens, set the local trend next to Virginia statewide trends from VADOC and national trends from BJS. Just keep the levels labeled. A local dip or rise may follow a statewide pattern, or it may not. The reports give you the raw years to judge for yourself.
Searching for Prince William County Inmate Records by Name
This topic covers population data, not individual lookups. To find one person in custody by name, use the Prince William County inmate records page, which explains how to verify custody with the ADC and how to search state and federal systems for a named person.
Where the Data Comes From
Each figure on this topic has a home. Local jail population data comes from the ADC annual reports. State custody data comes from VADOC. National data comes from the Bureau of Justice Statistics. Knowing the source keeps you from mixing a national rate with a local count.
The local jail does not publish a live population dashboard. The official path to county numbers is the annual report archive, which runs from 2009 through 2024. For questions the reports do not answer, the ADC main line is (703) 792-6420, and the office email is adc@pwcgov.org. Funds and records office hours run Monday through Friday.
Other county record pages connect to this topic. You may also want the Prince William County released inmates page for release checks, the arrest records page for booking data, or the court records page for case files. Each one routes to a different official source. Together they cover custody, charges, and population from end to end.
Note: County jail population figures must be read from the official ADC annual reports, while any per-100,000 rate shown elsewhere is state or national context.